Statistics  #
#
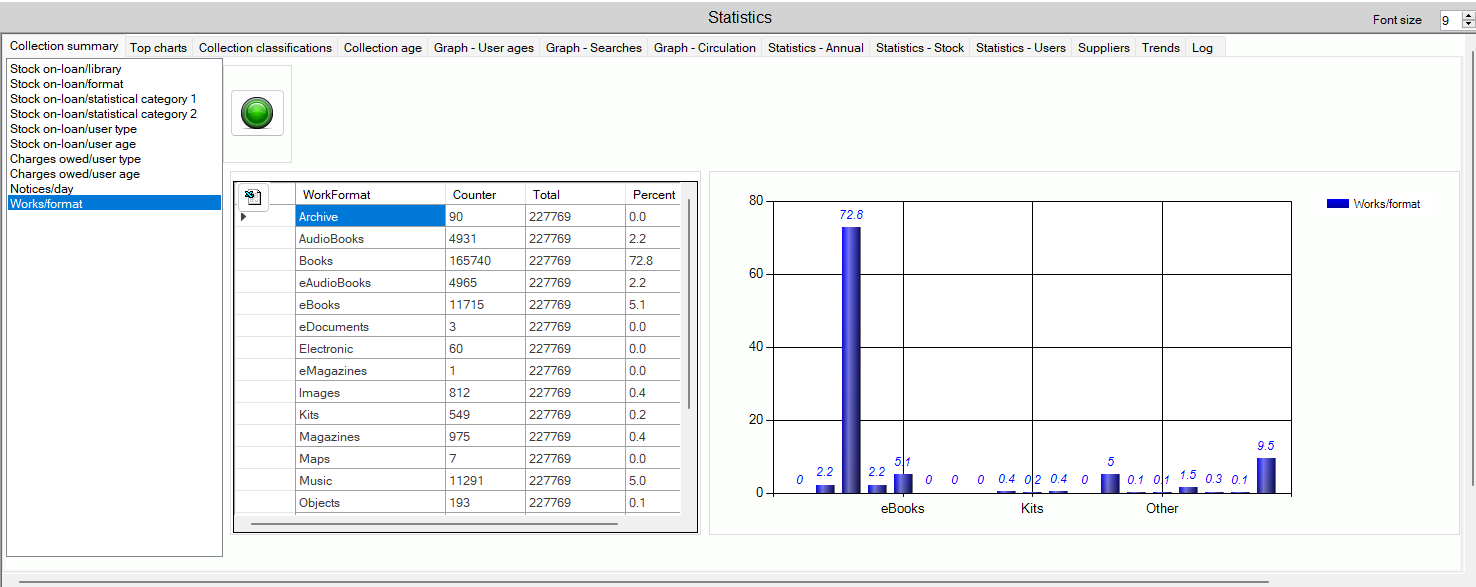
This section brings together some highly useful and informative management views of statistics on library collections and users. The opening screen presents separate tabs for the retrieval and display of the data:
Collection Summary | Top Charts | Collection – Classifications | Collection age | Graph – User ages | Graph – Searches |
Graph – Circulation | Statistics – Annual | Statistics – Stock | Statistics – Users | Suppliers | Trends | Log
Collection Summary #
Collection summary enables the running of a series of informational tables and graphs, these are:
Controls #
- Stock on-loan/library
- Stock on-loan/format
- Stock on-loan/statistical category 1
- Stock on-loan/statistical category 2
- Stock on-loan/user type
- Stock on-loan/user age
- Charges owed/user type
- Charges owed/user age
- Notices/day
- Works format
The Report is run by selecting a report and clicking. ![]() Go button
Go button
Results #
A table and matching graphic report are created for each of the reports.
Top Charts #
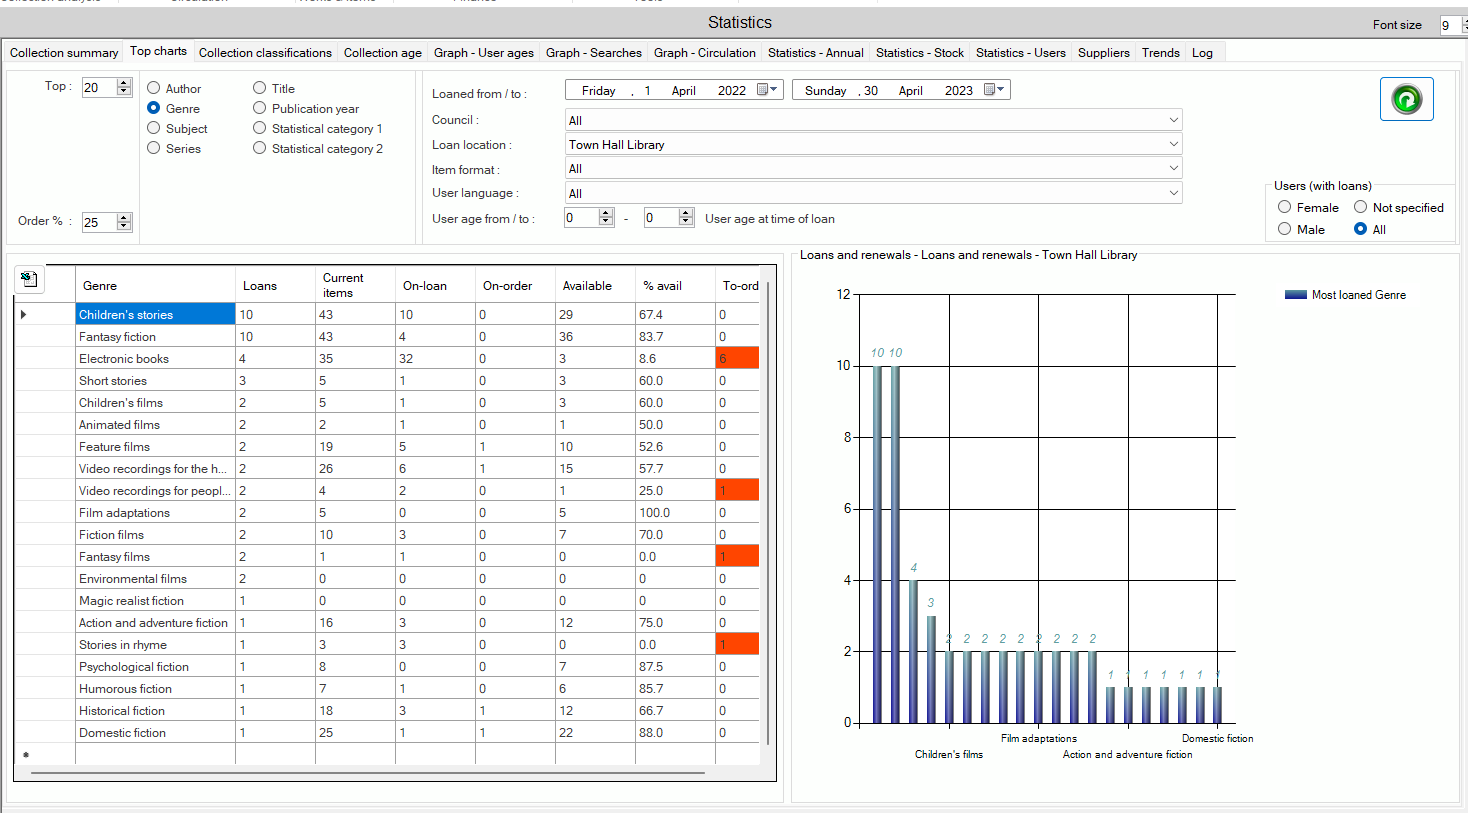
The Loans feature is provided to identify popular materials according to subject, author, title, series or publication date within a given time period.
Controls #
A simple control panel is presented:
Top: This control allows you to determine the number of results required. Set by default to 20, the number required may be selected using the combo.
Order %: Default to set to 25%
Style: Here you determine the nature of the results – to identify the most popular:
- Subject
- Genre
- Series
- Author
- Title
- Publication year
- Statistical category 1
- Statistical category 2
Date range: Dates can be set ‘from’ and ‘to’ (including the ‘to’ date)
Council: If your implementation is a Consortium system, then this combo allows selection of the Council for analysis.
Loan Location: If required, the analysis can be restricted to a particular library
Item Format: a drop down listing all formats in the system parameters
User Language: defaults to all and the drop downlist of the languages in the system
User Age: text box to input minimum and maximum age of users
Users (with loans): Radio buttons to select specific genders or all.
 Refresh: The Refresh button allows new parameters to be invoked – when a change to the controls is made, click this to get updated results #
Results #
Results are displayed in the lower portion of the screen, and are shown in two parallel panels:
Tabulated
Showing each year in the chosen span, and the tally of loans and renewals (combined) per appropriate heading.
Graphical
Rendering the tabulated data into a visual display using a bar graph.
Collection – Classifications #
The Classification feature provides a mechanism for analysis of book purchase according to classification, where this is recorded in the Dewey Decimal Classification system. The classification detail is taken from the call number applied to the item (rather than the assigned classification tag in the bibliographic details). Fiction (AF, JF, FIC) and other alphabetic call number types are not included.
The screen opens as below, allowing selection of the required Dewey range, and definition of the selection parameters:

Dewey Decimal section #
On the left hand side, a panel lists the entire Dewey classification breakdown, allowing selection at the main breakdown level, e.g. 700 (=700-799), or specific focus, e.g. 712. Selection is performed simply by highlighting the required element:
Please note the Multi-select checkbox to the right. If this is checked, then multiple Dewey selections may be ticked.
Selection parameters #
A number of parameters may be set for the analysis; these are grouped on a separate panel:
Start Date – Calendar date input
End date – Calendar date input
Council – If your library is a Consortium system, then this combo allows selection of the Council for analysis. The default selection is the Council associated with your workstation:
Locations – If required, the analysis can be restricted to a particular library (defaulting to the location associated with your workstation):
Radio button options
- Items added and replacement costs in classification
- Item Count – all subclassifications
Checkbox options
Multi-select – allows multiple dewy classifications to be selected on the left hand panel
- Titles added per year
- Loans per year – By checking the checkbox the count of loans and titles can be shown in context of the tally of loans over the same period
- Stock total
Refresh
 If any parameter is changed – including a Dewey selection – then the analysis must be re-invoked using the Refresh button.
Analysis
The results of the analysis are affected by the radio button and checkbox choices made above, and display data according the elements recorded by the library.
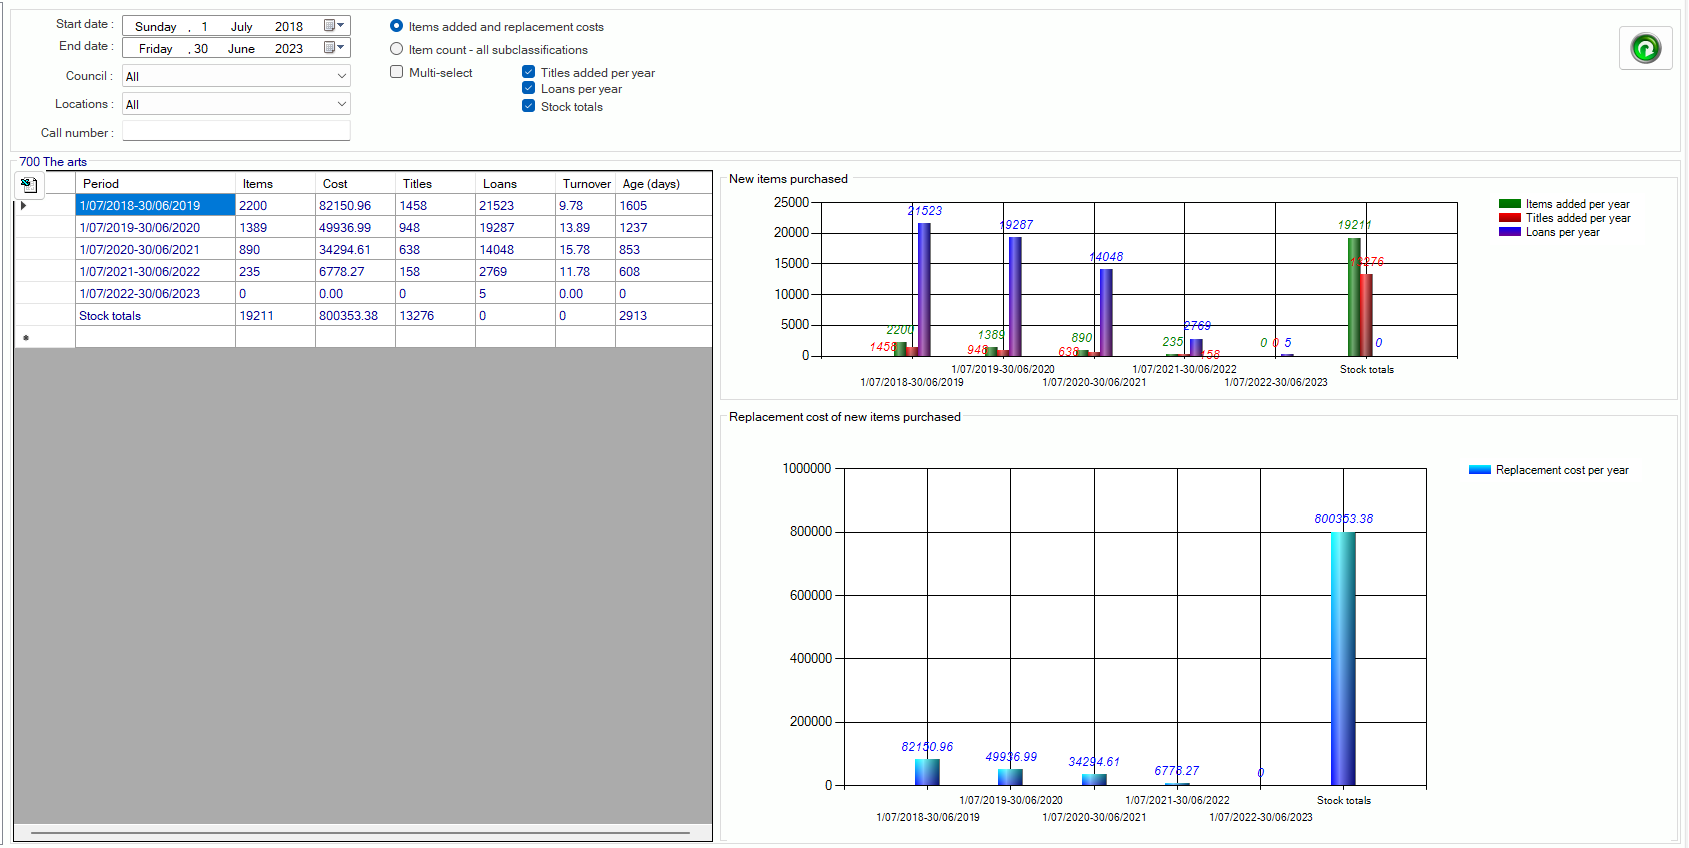
Items added and replacement costs in classification #
This analysis may be performed on any dewey selection and displays detail according to the library’s purchases over the period, according to the defined financial year in a rage of views
Table
- Items
- Titles
- Loans in the year for this stock (where checkbox ‘Show Loan Count’ is ticked)
- Cost
- Turnover
- age (days)
Graphical view Table
- New items purchased
- Replacement cost of new items purchased.
Item count – all subclassifications #
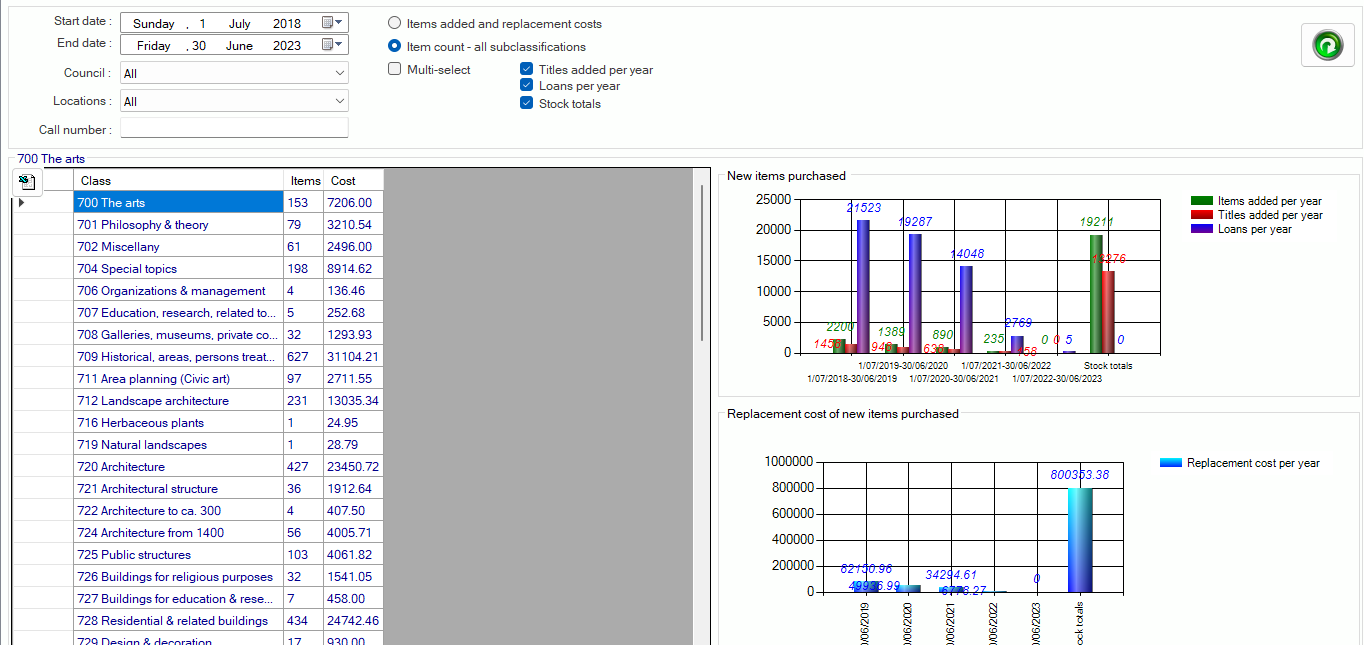
Dewey analysis can be by broad subject division, or focussed down to the level of individual elements (but not further):
Collection age #
This feature allows a library to see the age of its collections according to publication year. The view may be from point of view of works or of items, and, if items, may be focussed on a specific branch and specific formats at that branch.
The form opens so:
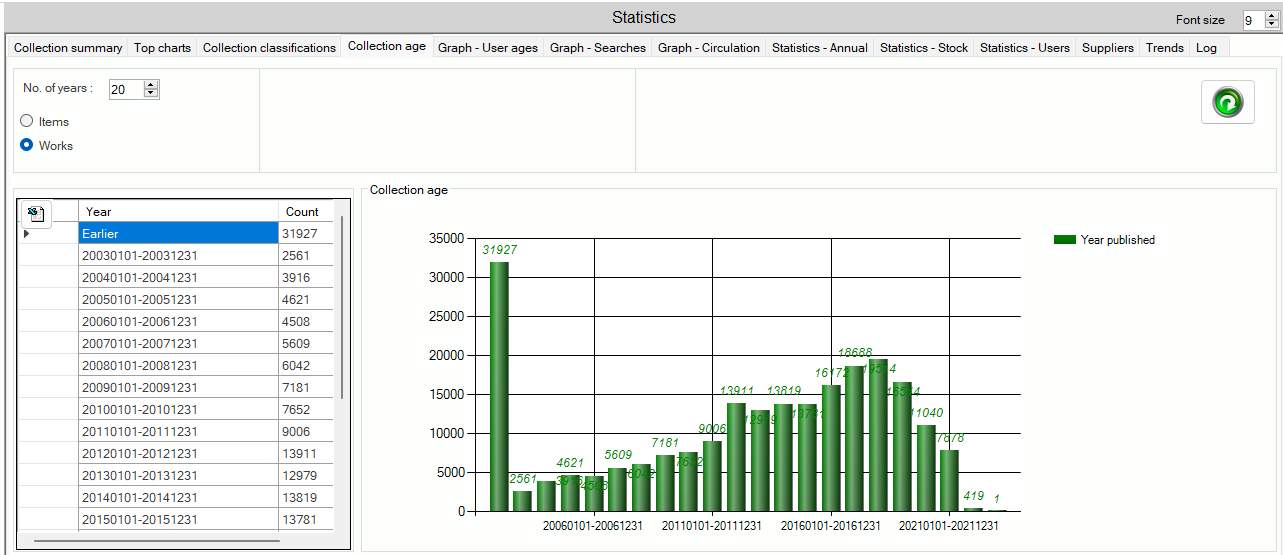
Filters #
Common
- Years – The number of years to be reported on is selected by a counter.
- Style – Works or Items: A radio button allows selection of the report style.
 Refresh – The Refresh button allows new parameters to be invoked – when a change to the controls is made, click this to get updated results.
Works
No further parameters are required for a Works analysis.
Items
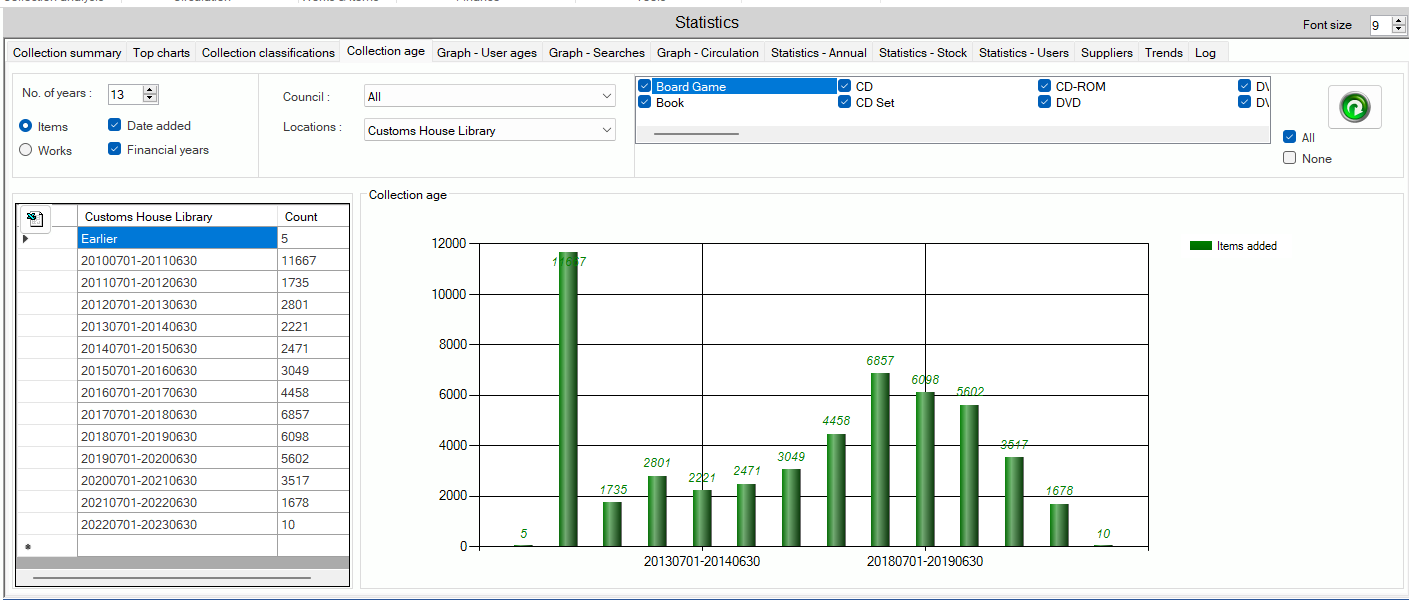
When the radio button for Items is selected, additional filters become available
Check boxes
- Date added
- Financial year
Location
- Council dropdown
- Location dropdown
Formats
- A set of checkboxes is displayed, allowing selection of one, some or all item formats.
- A separate control allows selection of All or None:
Results #
Results are displayed in the lower portion of the screen, and are shown in two parallel panels:
Tabulated
Showing each year in the chosen span, and the tally of works or items according to the year. Note that this data may be exported to Excel, using the button shown.
Graphical
Rendering the tabulated data into a visual display using a bar graph.
Note that ‘other year’ may refer to earlier publication or indicate that there is no date recorded in the MARC 260$c tag.
Graph – User ages #
This feature allows a library to see a profile of its users according to their age.
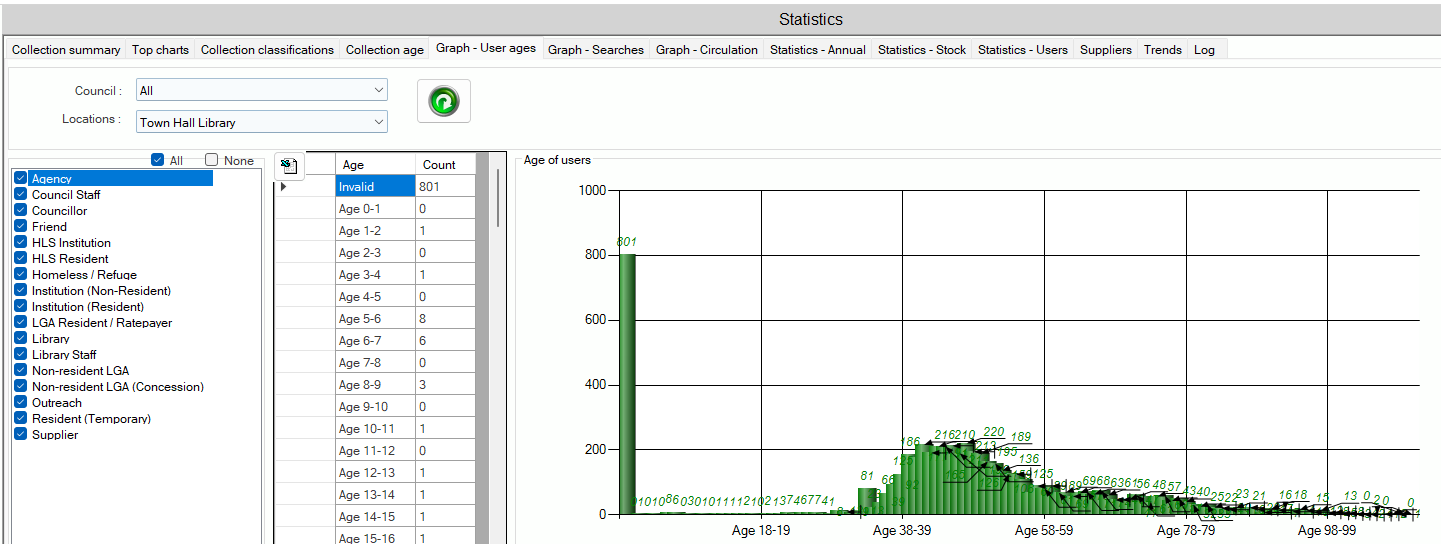
Controls #
Location
- Council – within a consortium system specific councils can be selected or all.
- Locations – Defaults to workstation location and can select other libraries or all.
User Type Check boxes
The User Type selections are displayed on the left. One, some or all types may be selected by checkbox. Above the panel, there are checkboxes to allow ALL or NONE of the user types to be selected. The default is ALL.
The graph must be initiated using the Refresh button.
Results #
On completion, the results are shown in two panels.
Tabulated
– showing each age year and the tally of users according to the age. If the user has no birthdate recorded, or if the calculated age exceeds 111 years, this will be indicated as ‘Invalid. Note that this data may be exported to Excel, using the button at the top left of the panel.
Graphical
– rendering the tabulated data into a visual display using a bar graph:
Graph – Searches #
This feature allows a library to view statistics of searches carried out over a period, separated into public (OPAC) and staff searches. The time period is selectable; statistics can be of either simple counts, or average response times.
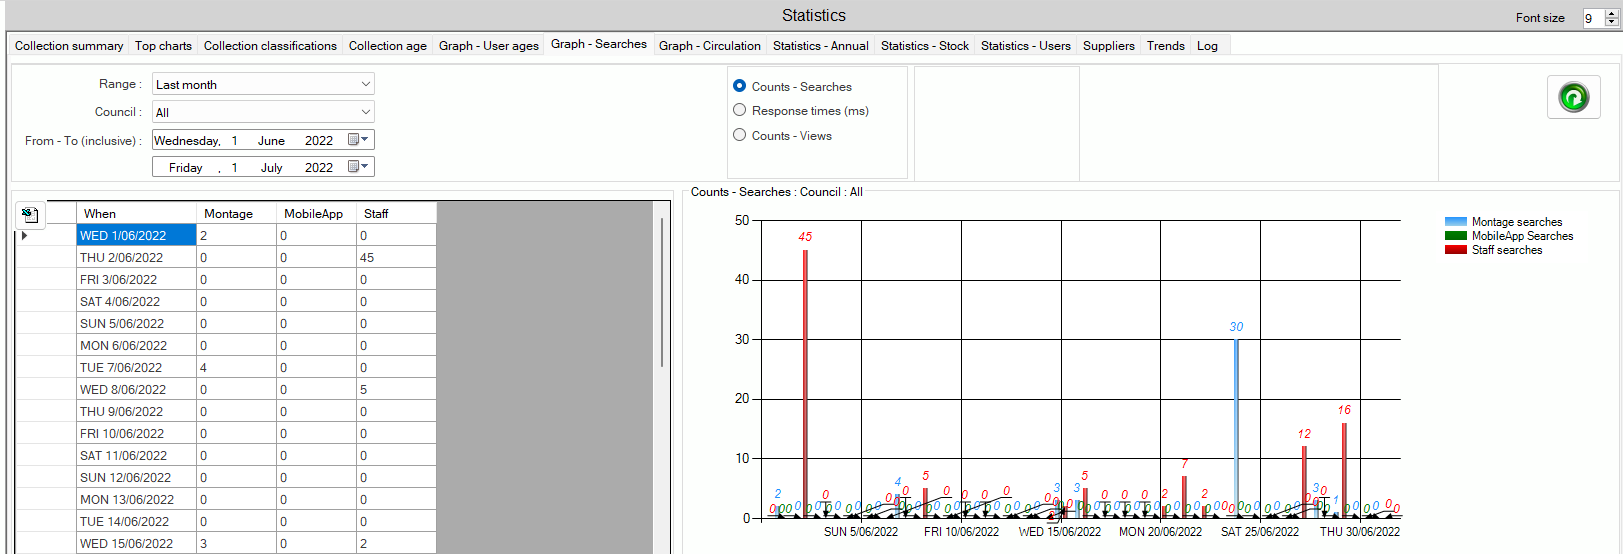
Controls #
Location
The view may be linked to a specific Council, within a consortium system.. By default the workstation’s Council (or Any, if not a Consortium) is selected.
Date range
Dates can be set manually using the calendar controls in each date box – or use the system Range pre-sets provided:
3 radio buttons are provided to allow analysis and show:
- Counts
- Response time (in milliseconds)
- Counts views
Results #
On completion, the results are shown in two panels
Tabulated
Here the results are shown for Counts – showing the tally of Montage, Mobile app and Staff enquiries for each date in the selected range. Note that this detail may be exported to Excel using the button in the to left of this panel.
Graphical
Rendering the tabulated data into a visual display using a bar graph:
Graph – Circulation #
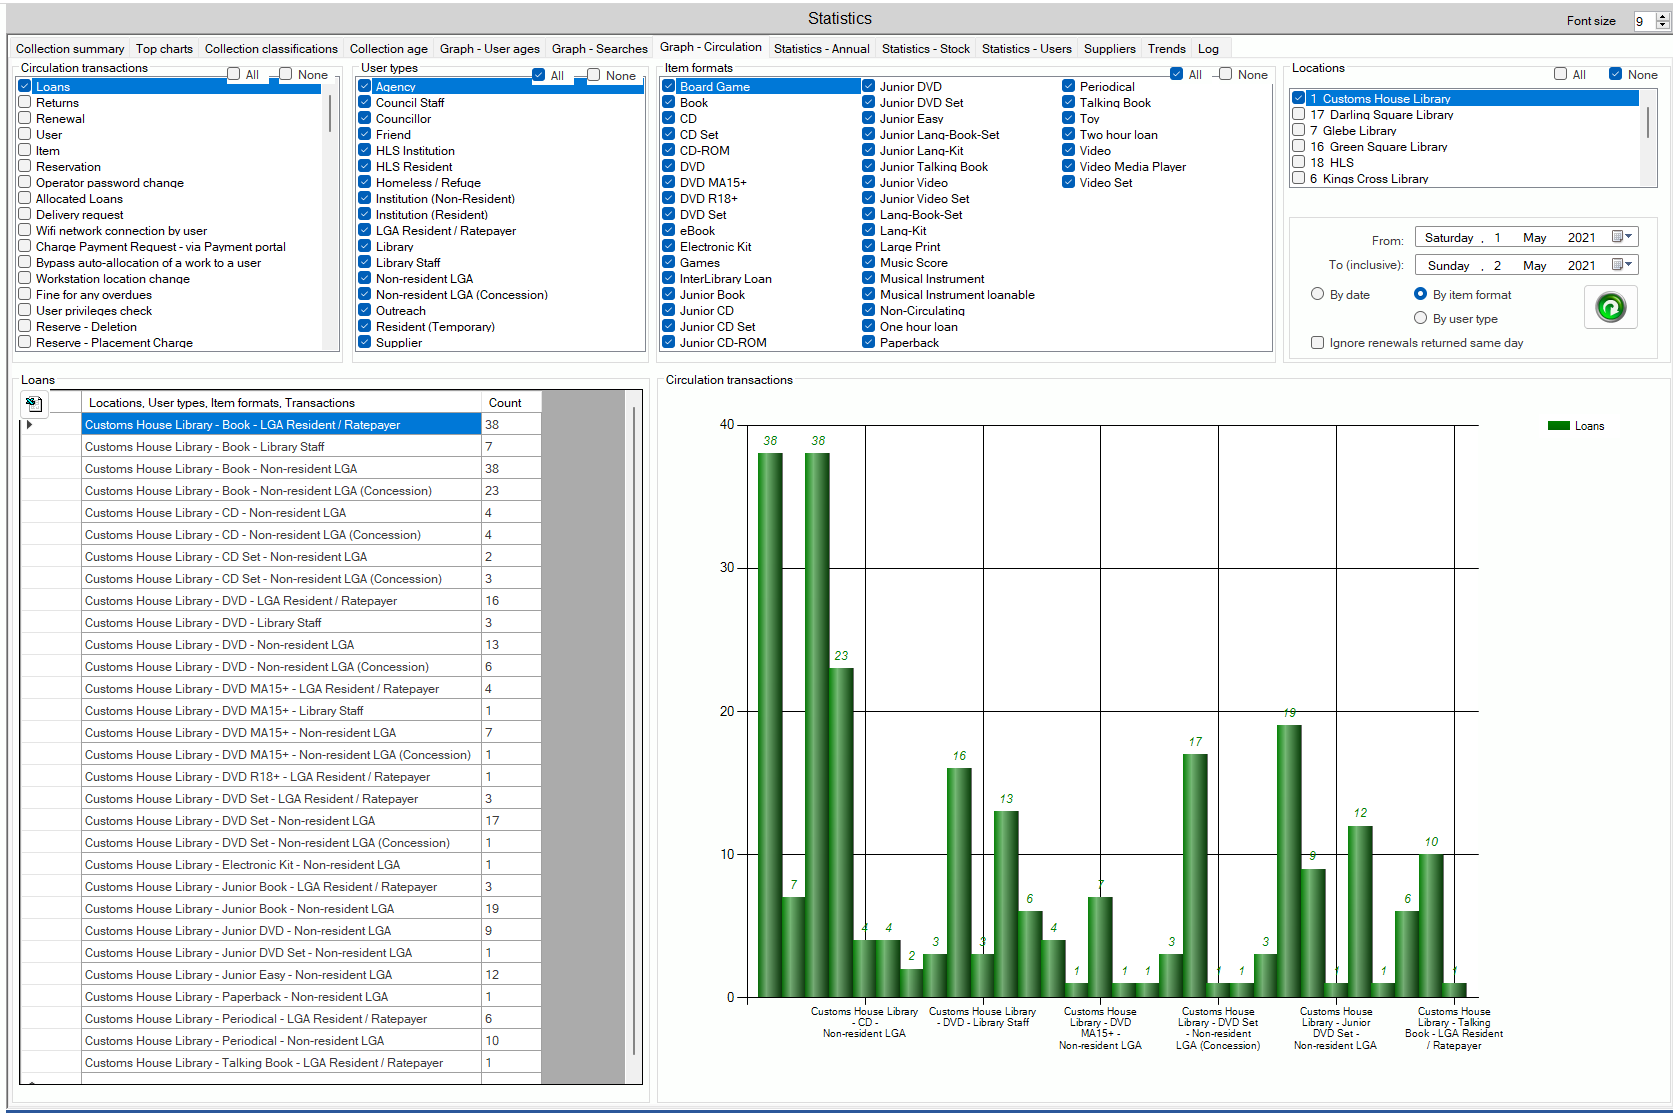
This comprehensive feature allows compilation of statistics related to transactions – for any transaction or combination of transactions, with further selections for user types, item formats, locations and date.
The opening default screen has no selections made for Transactions, User Types or Item formats, but will always select the locations associated with the Council (in a Consortium system):
Controls #
Five separate panels combine to define the selections for the required statistics. The top four each has a pair of checkbox options at the top of their panel, allowing for selection of ALL or NONE of the elements covered.
Circulation transactions (Panel 1)
Each transaction may be selected individually – or combined to form a combined graph. See here for a full list of transactions. Please note that if counting loan statistics, you will need to select Loans and Renewals (as Renewals are not recorded as Loan transactions) and Overdue Renewals (as these are not recorded as Renewal transactions). If in any doubt, please consult AIT.
User types
This panel reflects the User types defined for your system.
Item formats
This panel reflects the Item formats defined for your system.
Locations
This panel reflects the branches (logical locations) defined for your system.
Date range
This panel allows the setting of the date range to be covered by the statistics. Note that ‘To’ includes the set date – i.e. if counting loans to 31st December, the to date will include all loans on that date to 23.59.
Three options are available for presentation of the statistics:
- By date
- By item format
- By user type
An additional checkbox exists – Ignore renewals returned same day.
Refresh
 The statistics processing is invoked with this Refresh button
Results #
Following processing, the results are displayed in two separate panels:
Tabulated
The results are displayed in basic division according to the radio button option. Here by the date of transaction – but this may also be according to item format or material type, aggregating the transaction counts for the specific selection combination. Data in the current grid may be exported to Excel using the button at the top left of the panel.
Please note that if selecting more than one transaction, the tabulated view will only display results from one single transaction. The Transactions panel will show a reminder at the foot:
The transaction view may be changed by highlighting the transaction in the Transactions panel. This MUST be noted when exporting to Excel, as ONLY the current view is exported – so if performing a combined analysis of three transactions, each transaction must be viewed separately to allow full export.
Graphical
Rendering the tabulated data into a visual display using a bar graph:
Statistics – Annual #
This function allows calculation of statistics per financial year:
optionally quarterly or monthly, with accumulated totals, with additional options for:
- Council (in a Consortium)
- Branch location
- User type
- by library criteria
- Item format
- Statistical Category 1
- Statistical Category 2
- Transactions
- by user group
- by transaction:
- Loans, – optionally including renewals.
- reservations
- and in a consortium system, optionally including other council’s use of local material.
Control panel #
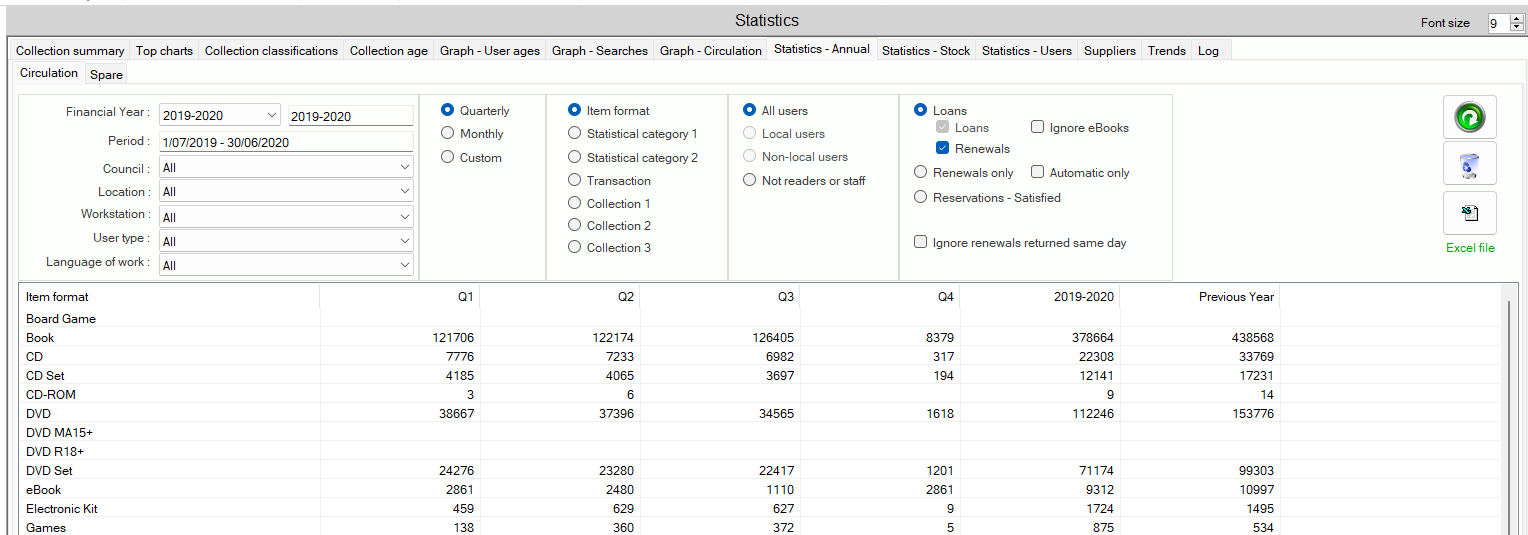
Date, Location, User type (Panel 1)
In this panel, the operator can choose:
- The Financial Year to be covered. This is selected from a combo drop-down menu and represents the Australia financial year (July 1 – June 30). The dates can be set in parameters – please notify AIT if you require variation from the Australian default. Note that the year must be selected from the drop-down, and this will show the current year by default. Once selected, the year will be reflected in the Span and Period boxes (these cannot be edited directly).
- Period – This field become a to from field when custom is selected
- Council. This applies specifically to Consortium systems. In other systems this will simply show ‘All’. In a Consortium, the drop-down will show the Councils represented, with the default being the Council associated with the current workstation.
- Locations. This combo will present all branches in your system (in the selected Council if in a Consortium), defaulting to All. If close focus is required, therefore, a specific branch may be selected for analysis.
- Workstation – allows the selection of workstation type e,g, staff, kiosk, public, smart shelf
- User types. This combo presents all user types defined in your system, defaulting to ‘All’. If close focus on a specific user type (one only) then this may be selected.
- Language of work – Language specified in 008/35
Tally period (Panel 2)
The operator can select the tally period:
- Quarterly (default)
- Monthly
- Custom – allows specific to and from date periods
Report criteria (panel 3)
In this panel, the operator can select how the statistics are to be shown in the ‘y axis’ of results. There are four options selectable by radio button:
- Item format (default)
- Statistical category 1
- Statistical category 2
- Transactions – Note that if ‘Transactions’ is selected, then the Transaction choice panel is hidden.
- Collection 1 – Note formats that are displayed in a collection are specified in System parameters – Item formats and grouping name in System Parameters – system – I1
- Collection 2 – Note formats that are displayed in a collection are specified in System parameters – Item formats and grouping name in System Parameters – system – I2
- Collection 3 – Note formats that are displayed in a collection are specified in System parameters – Item formats and grouping name in System Parameters – system – I3
User group
Four options are available for selection by radio button:
- All users (default)
- Local users. In a consortium system, this will reflect users registered with the chosen Council.
- Non-local users. In a consortium system, this will reflect users who are not registered with the chosen Council.
- Not readers or staff. This option allows grouping of all transaction activity for institutions and libraries.
Transaction choice
Radio Buttons
- Loans. Note that within Loans, there are two subsidiary checkboxes:
- Loans – this will count loan transactions only (ignoring renewals)
- Renewals – this will count renewals (per renewal)
By default, both checkboxes are selected, ensuring the count will include both transactions.
- Renewals only – With an associated Checkbox –
- Automatic only
- Reservations – Satisfied
There is also an additional checkbox,
- Ignore renewals returned the same day
- Applicable in a Consortium system:
Other council use of local items – When selected (by default), the results will include such counts in a consortium, it may be possible to count loans twice – once, where a loan of an item is performed by a council, and again when a loan of one of their items is performed at another council.
This new checkbox applies to reserves, as well as loans and renewals.
Note that if ‘Transactions’ is selected in Report criteria, then this panel is hidden.
Three command buttons are available:
 Refresh – this button invokes the compilation of the statistics
 Clear – clears any current results, allowing a fresh start
 Excel – allows export to Excel. If this command is used, the details are written to the Excel file, and the operator will be asked if this is to be opened. The Excel file presence will be indicated by the ‘Excel file’ link to the right of this command button becoming hyperlinked.
Statistics – Stock #
This function allows counts to be built for stock – current, added/deleted in a time period – according to Council (in a Consortium system) and branch location – according to item format, statistical category or Dewey Classification. Results can be output to Excel.
Control panel #

The Control panel is divided into separate specific panels:
Action/Council/Location (Panel 1) #
Action
There are six radio button options to determine the nature of the count:
- Current
- Added
- Deleted
- Added then Deleted
- Purchased
- Donated or free
Council/Location
Drop-down combo boxes allow you to select the Council (if in a Consortium) and location. The defaults are:
- Council – the Council associated with the defined workstation location – or ‘Any’ in a non-Consortium system.
- Location – allows choice of a specific branch for analysis, or ‘All’ for all branches in the Council/System (Default)
- Language of work – Language specified in 008/35
Date range
For a choice of action other than ‘Current’ an additional selection option is provided to allow definition of the time period to be covered:

Reporting options (Panel 2) #
Radio button options here allow selection of the reporting rows in the results panel [Note that the selections are determined according to the Action selection – see below]:
- Item format
- Statistical category 1
- Statistical category 2
- Statistical category 3
- Dewey Classification – Summary. This presents breakdowns according to the 10 major Dewey divisions.
- Dewey Classification – Full. This has associated controls to allow the extent of the Dewey classes to be defined, together with a refresh button. When Refreshed, the selected Dewey class options are displayed in the results panel.
- Number added per fund – (only added)
- Average item cost per fund – (only added)
Check Boxes + Loan status (panel 3) #
Checkboxes
- Items have barcodes now – The checkbox is only displayed for actions Current and Added
- Replacement costs – Not available in Added then Deleted
- Add default if no cost – Not available in Added then Deleted
Loan status radio buttons
- All
- On-loan
- Not on Loan
#
 Refresh – this button invokes the compilation of the statistics
 Clear – clears any current results, allowing a fresh start
 Excel – allows export to Excel
Results #
Results are written to the lower panel, and optionally to Excel.
Current + Item Formats:

Current + Dewey range:

Note that summaries are provided for each row and each column.
Statistics – Users #
This function allows counts to be built for library membership – current, added/deleted in a time period – according to Council (in a Consortium system) and branch location – according to a range of options, including user type, gender, status and postcode. Results can be output to Excel.
Command panel #

The Control panel is divided into separate specific panels:
Action/Council/Location (Panel 1) #
Action
There are three radio button options to determine the nature of the count:
- Current
- Added
- Deleted
Council/Location
Drop-down combo boxes allow you to select the Council (if in a Consortium) and location. The defaults are:
- Council – the Council associated with the defined workstation location – or ‘Any’ in a non-Consortium system.
- Location – All
Date range
- If Current is Selected,
- an optional tick box with active in last month with period in months input.
- an additional loan in this period tick box
- If a choice of action is made for ‘Added’ or ‘Deleted’,
- then an option is provided to allow definition of the time period to be covered in to from dates
User Reporting options (Panel 2) #
Radio button options here allow selection of the reporting rows in the results panel:
- User types
- Gender
- Language
- Statuses
- Category
- Resident
- Post codes
#
Three command buttons are available:
 Refresh – this button invokes the compilation of the statistics
 Clear – clears any current results, allowing a fresh start
 Excel – allows export to Excel
Results #
Results are written to the lower panel, and optionally to Excel.
User types:

Categories:

Note that summaries are provided for each row and column.
Suppliers #
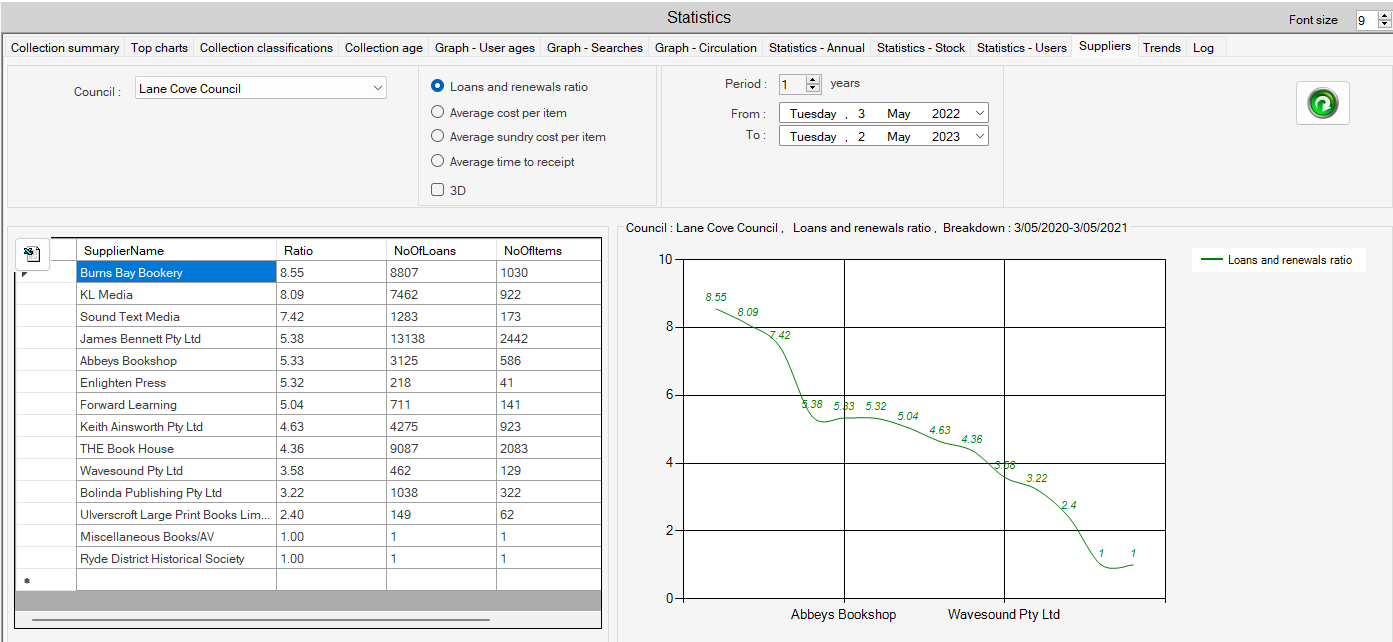
This screen allows a library to examine supplier performance by
- according to ‘Loans and Renewals ratio’ simply recording the number of loans per item supplied by the given supplier in the selected timeframe.
- by Average cost per item
- Average sundry cost per item
- by Average time from order to receipt
Trends #
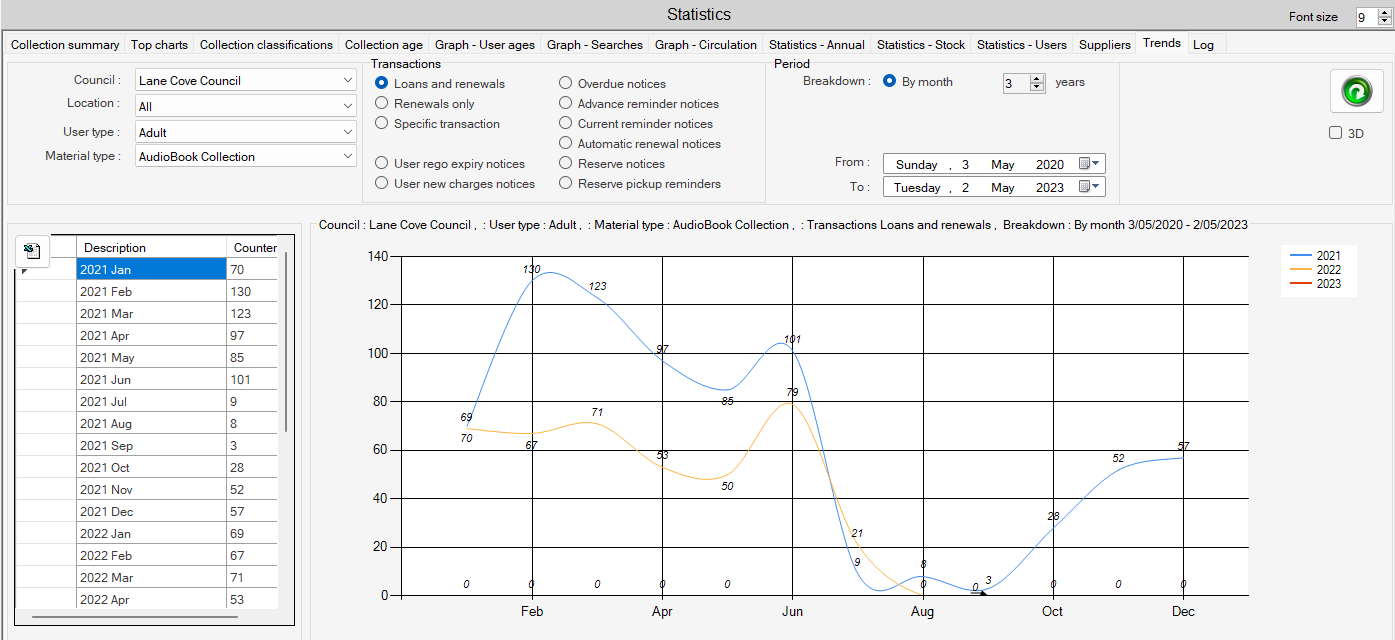
The Trends feature allows the library to view transactions statistics (initially just loans and renewals) plotted over a user-selected time period, comparing year-on-year to show seasonal patterns.
Command panel #
Location/ user #
Council – If your implementation is a Consortium system, then this combo allows selection of the Council for analysis. The default selection is the Council associated with your workstation. In a non-Consortium system, the default is All.
Location – If required, the analysis can be restricted to a particular library within the Council or System. The default is All.
User type – The analysis can be focused on a specific user type – the default is the first type, alphabetically – or set to All for general summary.
Material type – Similarly, a single material type can be selected – the default is the first type, alphabetically – or set to All for general summary.
Category Transactions #
- Loans and renewals.
- Renewals only
- Specific transaction
- user rego expiry notices
- user new charges notices
- Overdue Notices
- Advanced reminder notices
- Current reminder notices
- Automatic renewal notices
- Reserve notices
- Reserve pick reminders
Period
This panel allows selection of the required breakdown:
- Frequency. This is currently limited to ‘By month’
- Extent. The operator can use this control to select the number of years to be analysed. The default is 3
 Refresh – this button invokes the compilation of the statistics
-
Graph view – A checkbox allows selection of a 3D display of the results graph; this is not selected by default, meaning that the results appear in a simple line graph.
Results #
The results are displayed in the bottom panel, with a grid on the left showing the actual results per month. This detail may be exported to Excel. A line graph is then created on the right, with a key on the far right. In this example, taken from a backup, the current month transactions are incomplete, and appear to show a decline.

Once created as a line graph, the graph can be toggled to a 3D view, using the 3D checkbox:
Log #
The log tab shows details of errors and will as in the example below show when values do not match existing parameters. Any such instance found should be corrected. If you need assistance in identifying the instances via SQL, please contact AIT.

