Circulation per hour #
The Circulation per Hour function allows an interactive overview of transaction activity throughout the installed system. Selections allow the view to be focused on a branch, a collection, or a specific workstation, and on selected transaction types. Details can be exported to Excel.
Screen #

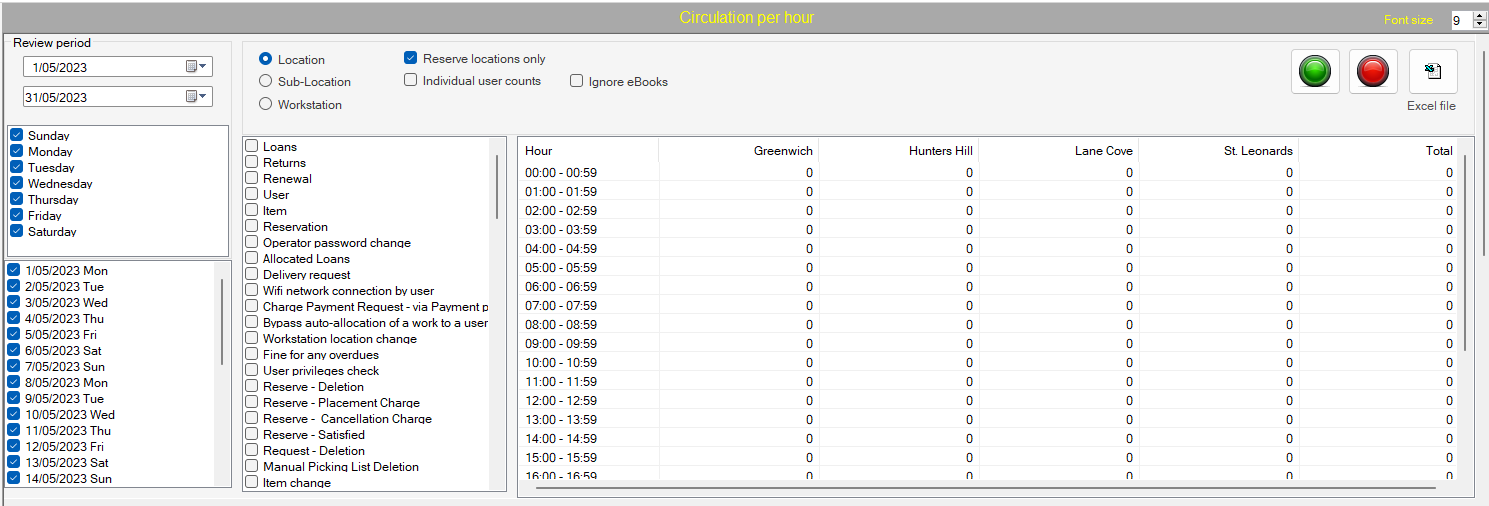
The opening screen is divided into a number of panels
Review period #

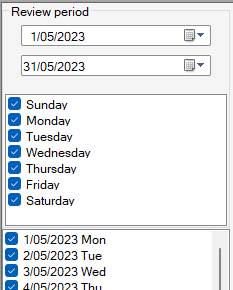
On the left of the screen, there are controls to select the period to be analysed. Libraries should not normally set this for more than one week, depending on the size of library operation. By default the whole of the current month is selected. Specific dates can be set using the calendar controls:
Please note that any date can be applied since Aurora was installed, but it is possible that earlier transaction logs may have been purged.
Radio button selection #
This panel provides three radio buttons for different views of workstation activity. Each workstation is associated with a physical location, and this allows interpretation in various contexts:
| Radio button | Notes |
|---|---|
| Location |
In this (default) view, the workstations are interpreted according to logical location, and so the activity can be shown according to library branch. When selected Checkbox options are available:
|
| Sub-location |
In this view, the physical location associated with the workstation is used. When selected Checkbox options are available:
|
| Workstation |
This looks at the activity for each individual workstation. When this option is selected additional radio buttons appear for (all, Staff, Kiosk, Smart shelf) When selected Checkbox options are available:
|
Transactions #
Each separate transaction that is recorded in the log is shown with a check-box allowing selection for analysis.
Any number of checkboxes may be selected, but please note that the tallies are the sum of ALL transactions, there is just one tally including them all. If specific transaction summaries are required, then only the ONE transaction should be selected.
Three command buttons are provided to:
 Start the analysis
 Stop the process
 Export results to Excel – when an Excel file is created, the ‘Excel file’ link below this button will be enlivened, and a double click will open the file.
Results #

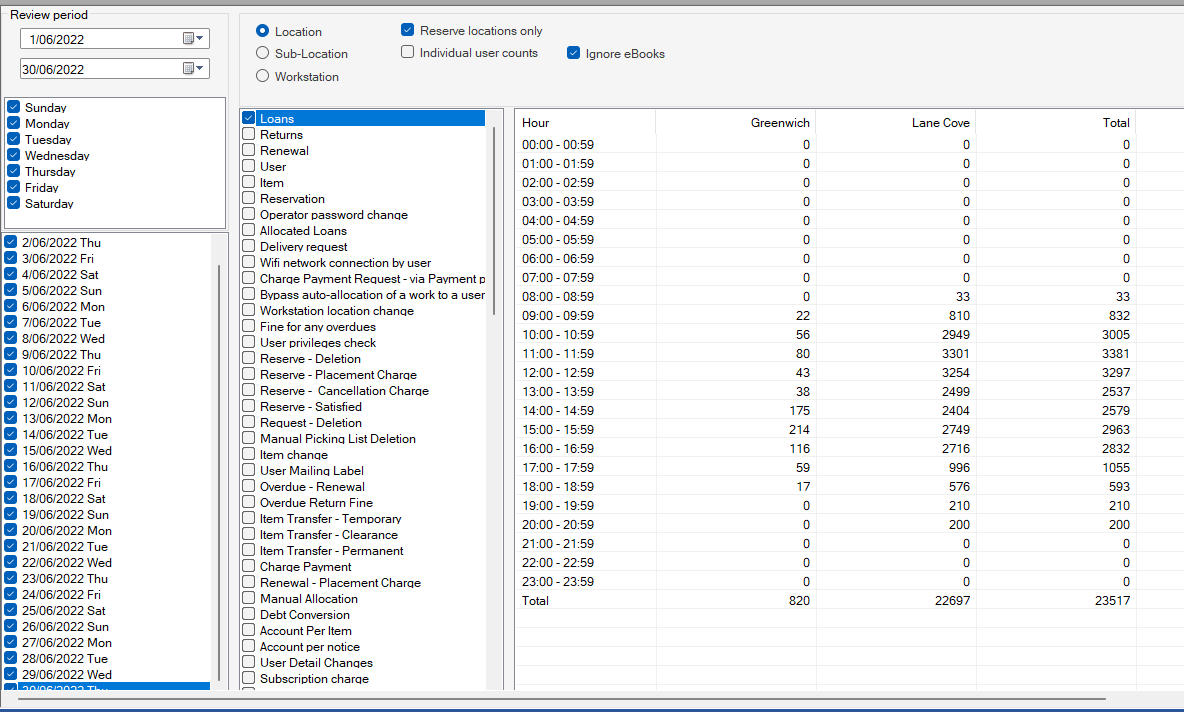
The results are presented – here according to Location – broken down by hour of the day. Totals are given for the specific location at the foot of the column, and for all locations for the specific time period in the rightmost row.

The results above show circulation by workstation filtered by kiosk type.
